RAMS (Telarus) Enterprise Platform
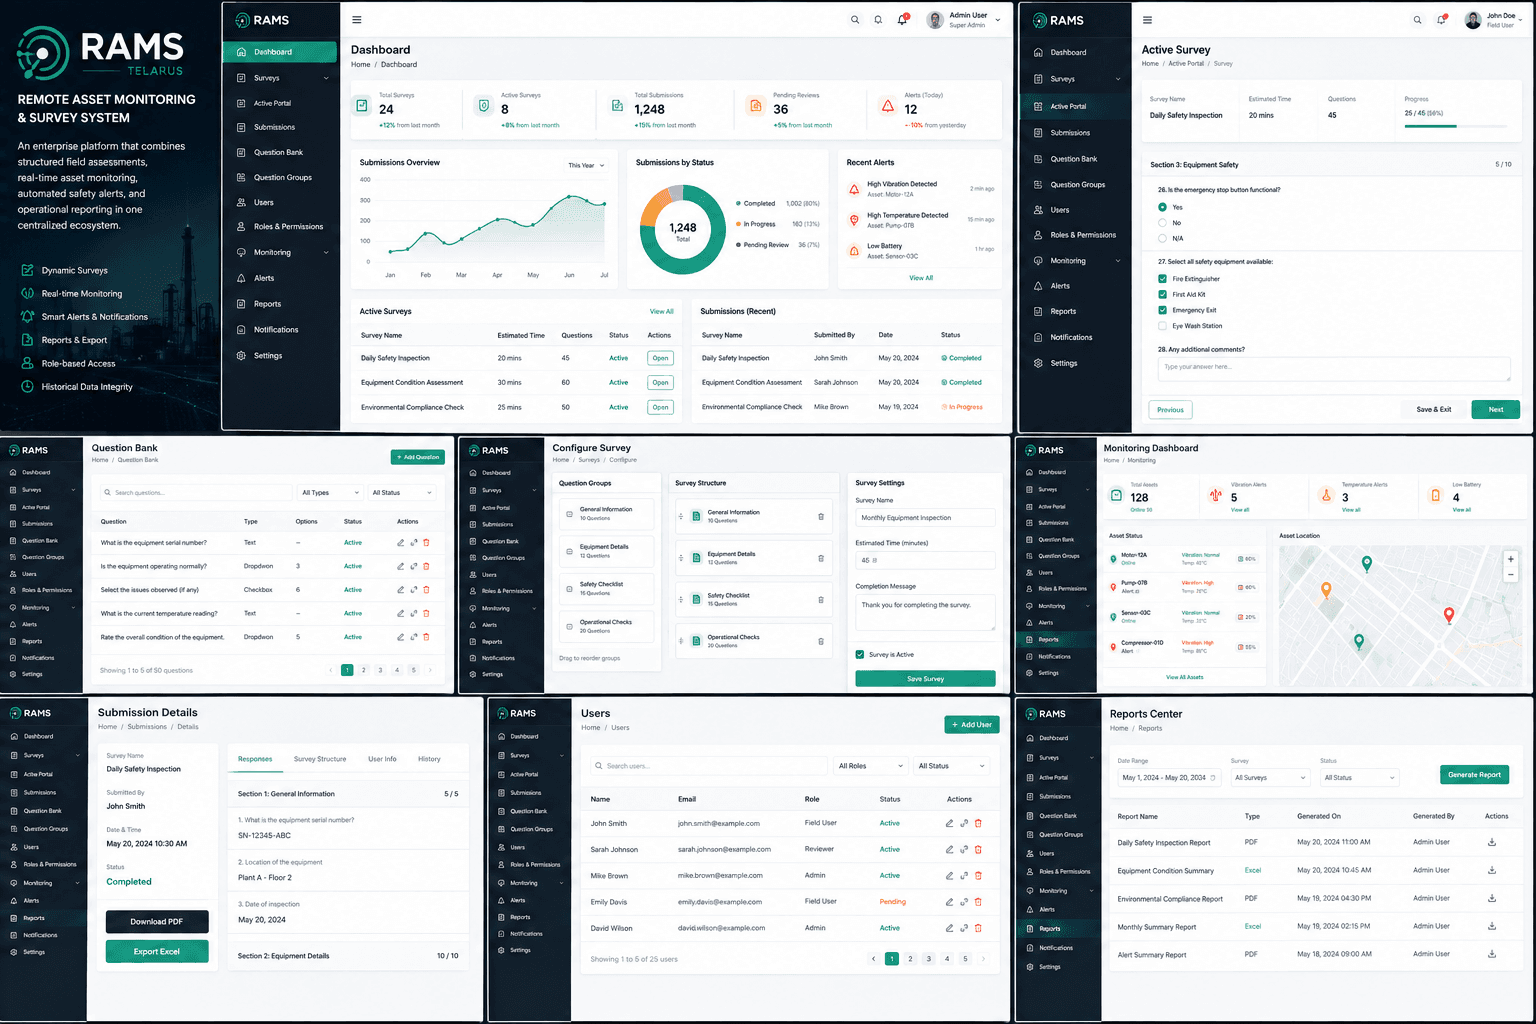
RAMS (Remote Asset Monitoring & Survey System) is a full-stack enterprise platform designed to combine structured field assessments, real-time asset monitoring, automated safety alerts, and operational reporting within a centralized digital ecosystem. The platform enables administrators to configure dynamic surveys, manage users and permissions, monitor sensor-driven environmental conditions, capture field data, preserve historical submission snapshots, and automatically generate reports and notifications. It is designed for high-stakes operational environments where data accuracy, traceability, automation, and real-time visibility are critical.
Project Overview
RAMS (Remote Asset Monitoring & Survey System) is an enterprise operational intelligence platform that brings together human-driven field assessments and automated asset monitoring within a single system. The platform is designed to transform raw survey and sensor data into actionable operational insights.
User & Access Management: Administrators can create, approve, manage, and configure user accounts while assigning roles and granular permissions. New accounts remain restricted until they are explicitly approved by an authorized administrator.
Dynamic Survey Framework: The platform uses a flexible three-level survey architecture consisting of Questions, Question Groups, and Surveys. Administrators can create reusable questions, organize them into logical groups, and combine those groups into complete assessment workflows.
Question Management: The Question Bank provides centralized management of individual assessment questions. Questions support different input types and configurable options, allowing the system to support a wide range of inspection and assessment scenarios.
Survey Configuration: Administrators can configure complete surveys by combining question groups, controlling their order, defining estimated completion time, and configuring completion messaging.
Field Assessment Portal: Published surveys become available through the Active Portal, where authorized users can execute assessments, enter responses, and submit completed data from a structured interface.
Historical Data Integrity: Every completed assessment is stored as a complete state snapshot. The result preserves the survey structure, questions, responses, and relevant user information exactly as they existed at the time of submission, protecting historical records from future configuration changes.
Operational Dashboard: The dashboard provides management with centralized visibility into submitted assessments, operational activity, completion status, user activity, filtering, and export capabilities.
Automated Reporting: Once an assessment is completed, the system automatically processes the result and generates a PDF report. The generated report is associated with the submission and made available through the archive and reporting interfaces.
Real-Time Monitoring: The backend includes automated monitoring services that process incoming vibration, temperature, and battery-related sensor data and compare readings against predefined safety thresholds.
Safety Alert Intelligence: When monitored sensor values exceed configured thresholds, the system automatically triggers notification workflows to alert relevant personnel through email or SMS channels.
Notification Automation: Notification templates support dynamic placeholders such as user names, dates, and other contextual information, allowing the system to generate personalized operational alerts automatically.
Compliance & Archive: Historical submissions, generated reports, and assessment records are preserved in a centralized archive, providing organizations with an auditable record of completed field activities.
Key Features
Technologies Used
Challenges
Designing a flexible survey architecture capable of supporting different assessment types without hardcoding individual survey structures
Maintaining historical data integrity when questions, groups, surveys, or user information change after an assessment has been completed
Supporting granular user roles and permissions while allowing administrators to customize the user interface according to access levels
Building a scalable system capable of processing large volumes of survey submissions and operational records
Providing real-time visibility into operational data through dashboards and advanced filtering
Automating report generation immediately after survey completion without disrupting the user workflow
Monitoring multiple types of sensor data and identifying potentially dangerous threshold violations
Triggering reliable email and SMS alerts when safety-related sensor conditions are detected
Maintaining an auditable archive of completed assessments and generated reports
Supporting both human-generated assessment data and machine-generated monitoring data within one operational ecosystem
Providing flexible exporting capabilities for stakeholders requiring PDF reports or spreadsheet-based operational data
Creating a maintainable enterprise architecture capable of supporting future monitoring devices, assessment types, and automation workflows
Solutions
Dynamic Survey Architecture: Implemented a reusable Question → Question Group → Survey hierarchy that allows administrators to build complex assessment workflows from configurable components instead of hardcoded forms.
Historical State Snapshots: Designed the Result model to store a complete snapshot of the survey configuration, questions, user context, and submitted responses at the time of completion, ensuring historical records remain accurate even when master configurations are later modified.
Enterprise Access Control: Implemented structured user roles, approval workflows, granular permissions, and configurable menu items to ensure users only access authorized functionality.
Modular Angular Architecture: Built the frontend using Angular, RxJS, Angular Material, and the Fuse framework to provide a structured enterprise interface with reusable components and reactive data handling.
Scalable Node.js Backend: Developed the backend using Node.js and Express.js with a modular API architecture capable of supporting user management, survey configuration, result processing, monitoring, reporting, and notification services.
Automated Result Processing: Connected survey submission workflows to backend result-processing services so completed assessments can automatically trigger report generation, dashboard updates, and notifications.
Automated PDF Reporting: Integrated PDF generation to create standardized assessment reports immediately after submission and associate generated documents with their corresponding records.
Excel Data Export: Implemented spreadsheet export capabilities to allow administrators and stakeholders to extract operational assessment data for analysis and external reporting.
Advanced Record Filtering: Developed filtering capabilities for large datasets using date ranges, completion status, user information, and other operational criteria to help administrators locate relevant records efficiently.
Safety Watchman Monitoring: Implemented background monitoring processes for vibration, temperature, and battery readings, continuously evaluating incoming sensor data against predefined thresholds.
Automated Alert Engine: Developed notification workflows that trigger when monitored sensor values exceed defined safety limits, enabling rapid response to potentially critical environmental or asset conditions.
Multi-Channel Notifications: Integrated AWS SNS and Nodemailer to support automated SMS and email communication for operational alerts and assessment notifications.
Dynamic Notification Templates: Added placeholder-based notification templates that can dynamically inject contextual information such as user names, dates, and assessment details into automated messages.
Centralized Archive: Created dedicated submission history and reporting interfaces to preserve completed assessments and provide authorized users with convenient access to historical records and generated PDF reports.
Operational Intelligence Dashboard: Combined real-time data, filtering, status tracking, and export capabilities into a centralized dashboard to help management monitor field activity and identify operational trends.
Want to build something similar?
Let's discuss your project and bring your ideas to life with our expertise.
Start a Project